Assessing Deforestation with GIS
Using Geographic Information Systems to Track Forest Degradation
To combat this issue, the United Nations introduced REDD+, an incentive-based program aimed at halting forest degradation in these countries.
Within this framework, Vexiza has developed a tool for Calyx Global to evaluate deforestation risk and detect spatial patterns linked to forest loss, bolstering informed political decisions aimed at sustainable development.
Research on Planned and Unplanned Deforestation
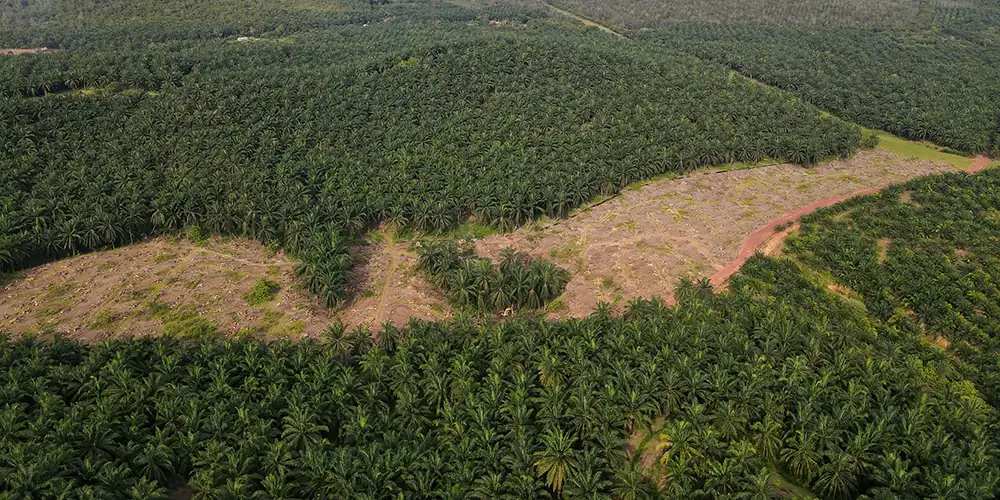
The platform facilitates the evaluation of the impact of planned deforestation, resulting from government authorizations for infrastructure projects such as reservoirs or roads, and land use change permits for farming or mining.
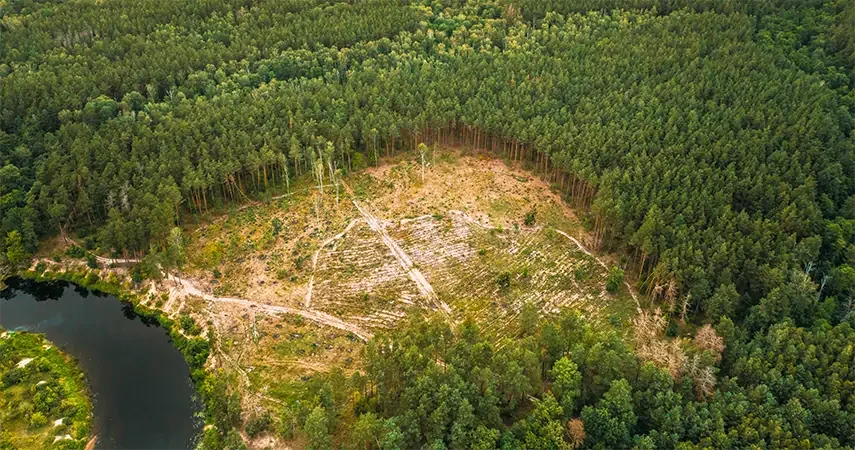
Furthermore, it allows for the estimation of unplanned deforestation, which occurs as a result of activities such as illegal logging, shifting agriculture, or unauthorized construction of housing.
Since this deforestation usually takes place in easily reachable areas or near urban centers, the application combines data from databases on populated sites and population density, hydrology, roads, and digital elevation models; in short, the factors most related to accessibility to forest areas.
Together with the analysis of deforestation and forest cover data from Global Forest Watch, the tool can estimate the percentage of deforested areas in any country around the world.
Deforestation Risk Mapping
Due to the complexity of these data, geographic information systems facilitate the efforts of decision-makers in reforestation initiatives.
Using Leaflet, we can represent several layers of geographic information, highlighting surfaces both outside and within concession boundaries.
Featuring a 6km resolution, the viewer enables a straightforward comparison of planned and unplanned deforestation. This approach makes it easy to visualize the factors driving deforestation and to know if it happens around roads, cities, or close to public concessions.
Knowing deforestation trends on a district-by-district basis helps coordinate new regulations with regional authorities in areas like urban planning, natural reserves protection, and agricultural practices.
Greenhouse Gas Emissions Analysis
Finally, another key feature of the tool is the calculation of the tons of CO2 that would be emitted if the forecasted forest degradation takes place, caused by the release of carbon stored in the biomass and soil.
This helps identify regions where new reforestation plans are most needed or where carbon offset projects, such as building renewable energy parks, should be encouraged to meet REDD+ targets.
In conclusion, geographic information provides governments with a valuable tool for ecosystem conservation and restoration. As demonstrated in other Vexiza projects related to carbon footprint, technology and innovation show that economic growth and responsible environmental management can go hand in hand.
Technologies and technical details
Vue.js
Node.js
Express
MSSQL